
9. The UK Government Dietary Recommendations
The government’s recommended dietary intake of nutrients can be found in exhausting detail in this document : https://assets.publishing.service.gov.uk/government/uploads/system/uploads/attachment_data/file/618167/government_dietary_recommendations.pdf .
I have reproduced table 2 from that document below :
|
(years) |
19 - 64 |
65 - 74 |
75+ |
|
||||
|
Gender |
Males |
Females |
Males |
Females |
Males |
Females |
|
|
|
|
||||||||
|
Energy(MJ/day) |
10.5 |
8.4 |
9.8 |
8.0 |
9.6 |
7.7 |
|
|
|
Energy (kcal/day) |
2500 |
2000 |
2342 |
1912 |
2294 |
1840 |
|
|
|
|
||||||||
|
Macronutrients |
|
|||||||
|
Protein (g/day) |
55.5 |
45.0 |
53.3 |
46.5 |
53.3 |
46.5 |
|
|
|
Fat (g/day) [Less than] |
97 |
78 |
91 |
74 |
89 |
72 |
|
|
|
Saturated fat (g/day) [Less than] |
31 |
24 |
29 |
23 |
28 |
23 |
|
|
|
Polyunsaturated fat (g/day) |
18 |
14 |
17 |
14 |
17 |
13 |
|
|
|
Monounsaturated fat (g/day) |
36 |
29 |
34 |
28 |
33 |
27 |
|
|
|
Carbohydrate (g/day) [At least] |
333 |
267 |
312 |
255 |
306 |
245 |
|
|
|
Free sugars (g/day) [Less than] |
33 |
27 |
31 |
26 |
31 |
25 |
|
|
|
|
||||||||
|
Salt (g/day) [Less than] |
6.0 |
6.0 |
6.0 |
6.0 |
6.0 |
6.0 |
||
|
Dietary fibre (g/day) |
30 |
30 |
30 |
30 |
30 |
30 |
||
This document contains very detailed numerical recommendations for the daily consumption of macronutrients, vitamins and minerals, but while it will state that a male aged 19-64 should consume precisely 55.5g of protein per day, it does not really explain how that number is arrived at or whether that number applies equally to everyone in all circumstances. Furthermore if you look at similar guides from other countries you can see surprising variations in the recommendations, which may be one way of saying that nutritional science is not that exact and is constantly evolving. This perhaps explains why some of the recommendations in the not so recent past about, for example, the consumption of dietary cholesterol have been subsequently overturned, and more recently we learn that saturated fat may not after all be that evil. Having spent over eighteen years designing diagnostic medical electronic equipment I have read a great deal of such advice in medical papers and now tend to take it as advisory rather than mandatory. In fact if you try to follow all the advice you find conflicts, inconsistencies and unanswered questions that could drive a normal person nuts. So I stay in touch but confess to becoming a tad weary by the changing picture. Eating a diet with real food is so much easier and less less stressful! Just follow Michael Pollan’s general advice to “Eat food. Mostly plants. Not much.”.
9.1 The protein intake conundrum
I have highlighted the recommendation for protein in particular as I am confused about what is required to support normal growth and what may be harmful in terms of cancer risk if consume in excess. So what recommendations have I come across?
The UK government states 55.5g per day in the table above for males aged 19-64. It is an absolute number rather than an “up to” or “more than”. This seems to be a common recommendation and based on the amount of protein that the body consumes on average each day.
Dr Michael Mosley reports in “The Fast Diet” that Professor Valter Longo, who is director of the University of Southern California’s Longevity Institute, recommends restricting protein intake to less than 0.8g per kg of body weight in order to reduce the level of IGF1 growth hormone in the blood stream as high levels of this hormone later in life lead to increased ageing and risk of cancer. For my weight of 68kg that means a maximum of 54.4g of protein per day, which is almost exactly what the UK government recommends but I find it almost impossible to keep to that level. In fact my average consumption, post weight loss, is 100.8g, which is almost twice that limit. There is a surprising amount of protein in fruit and vegetables which I now eat lots of so I would probably have to remove meat and oily fish from my diet and drastically reduce dairy as well (hence reducing the beneficial kefir) in order to meet that 55g limit.
On the other hand I exercise a lot with both cardio and resistance, and building lean muscle also requires protein. The question is how much extra is needed? The TDEE calculator mentioned in section 3.4 allows you to calculate the level of macronutrients required to maintain your body weight. Plugging in my figures, it recommends 177g protein, 92g fat, and 207g of carbohydrates for a “moderate carb” diet. For a “low carb” diet those numbers become 237g protein, 105g fat and 118g carbohydrate. Both scenarios contain much higher protein than the other recommendations based on IGF1 concerns, but would the increased level of exercise and fasting help to counteract that? The only way to find out is through an IGF1 blood test so I will attempt to get this measured next time I am in Edinburgh.
My average levels of macro nutrients during my six month weight loss phase were :
Carbohydrates : 142g
Fat : 69.8g
Saturated fat : 24.8g
Protein : 83.6g
Fibre : 28.2g
Now that I am eating more of the same kinds of food to maintain my weight my macros are :
Carbohydrates : 158g (+16%)
Fat : 105.9g (+52%)
Saturated fat : 35.0g (+51%)
Protein : 100.3g (+20%)
Fibre : 39.6g (+40%)
which means the relative proportions of my calorie intake are : 32% carbohydrate, 48% fat; 20% protein. It is an inevitable consequence of cutting carbohydrates that more fat and protein has to be consumed to achieve the daily calorie requirement. Since my blood lipid values are now all in then normal range all I can say is that this regime works for me, and I no longer fear fat! Is it healthy? For me it is demonstrably healthier than my former diet which provided almost 70% of my calories from carbohydrates, including more than 40% from starchy carbohydrates.
So after my weight loss phase ended I have only increased carbohydrates by a modest amount (16%) and these all come from whole grains. Most of the additional kcals needed to maintain my weight have come from increased fat and protein consumption (although these are the healthy mono and polyunsaturated fats from nuts, avocados, and olive oil). Reconciling all the conflicting pieces of official nutritional advice into the “ideal diet” with some theoretically perfect balance of macronutrients is frankly impossible because there is no definitive standard among the nutritional experts globally on precisely what we should be eating. So I am pretty relaxed about what I eat and will continue with the dietary approach that has produced such spectacular improvements in my blood lipids and sugar, namely the 5:2 Fast + Mediterranean Diet, an approach focused on real food which perfectly encapsulates the advice of Michael Pollan to “Eat food. Mostly plants. Not much.”
9.2 How to convert macro nutrient weight to kcals
You can easily convert the weights of the macro nutrients in your food to kcals using a conversion rate of 4kcals/g for carbohydrates and protein, and 9kcal/g for fats. (Although I’m sure you probably never touch alcohol, you might be interested to learn that the relevant conversion for pure alcohol is 7kcals/g. Of course beer contains a lot of carbohydrate as well as alcohol, so you need to be aware of this if you are trying to lose weight. It’s not called “liquid toast” for nothing!).
My average daily kcals can be calculated from the macronutrient levels specified above as follows:
Average intake of macronutrients = 4x158g [carbohydrates]+ 9x105.9g [total fat] +4x100.3g [protein] = 1986kcals
This figure will continue to increase slightly as I adjust to “normal” eating to maintain body weight at a constant level. Note that I did not include saturated fat in the calculation above as saturated fat is included in the value for “Total Fat” on food labels. Likewise the contribution to kcals from Fibre which forms part of the Total Carbohydrate value.
9.3 The Eatwell Guide
The UK government’s dietary recommendations have been condensed into a “simple” pictorial chart that shows the relative proportions of food types we should eat for a healthy diet. You can wade through all the supporting documentation to the guide here : https://www.gov.uk/government/publications/the-eatwell-guide and the resulting chart is reproduced below. It looks pretty straightforward at first glance but first impressions can be misleading and as you delve deeper it just becomes really confusing.
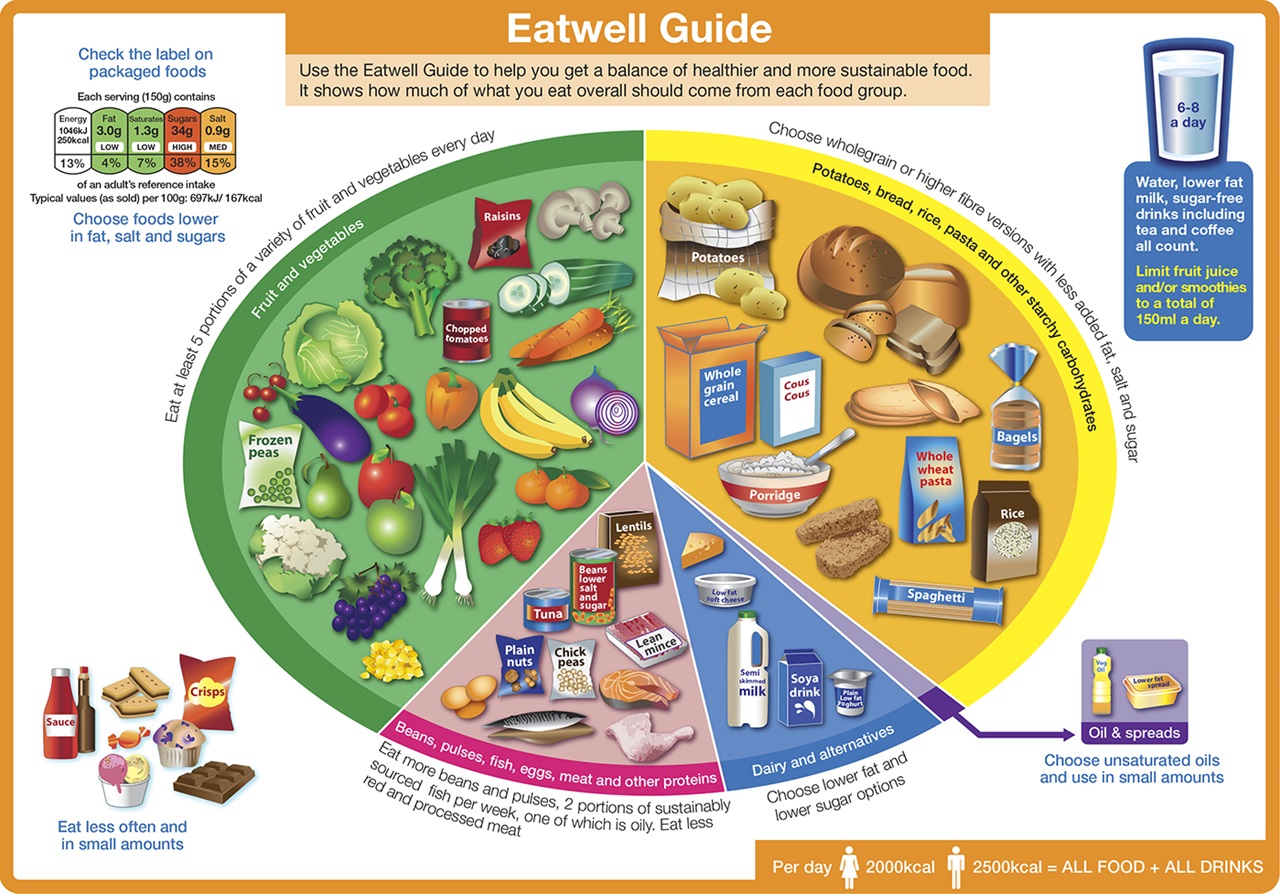
At first glance, it does seem to be a pretty obvious depiction of the relative proportions of the different food types we should eat. As declared at the top of the picture : “It shows how much of what you eat overall should come from each food group”. But what exactly does it mean by “… how much …”. Are the relative proportions based on kcals, or weight of , or volume of food? The inclusion of recommended daily kcals consumption figures at the bottom of the chart could reasonably imply that the chart shows the recommended consumption of food types in kcals. The chart is silent on the matter but I believe it actually represents a breakdown by weight since Table 3 of the Eatwell Guide document : “From Plate to Guide: What, why and how for the eatwell model” , which you can find here : https://assets.publishing.service.gov.uk/government/uploads/system/uploads/attachment_data/file/579388/eatwell_model_guide_report.pdf mentions, in just one place, that it is the percentage weight of food that has been used in the plate shown on the Eatwell Guide. I’ve reproduced that table below for reference :
Table 3. Contribution of Eatwell Guide food group to overall dietary intake
|
Food category |
Weight of food (%) |
|
Fruit and vegetables |
39% |
|
Potatoes, bread, rice, pasta and other starchy carbohydrates |
37% |
|
Beans, pulses, fish, eggs, meat and other proteins |
12% |
|
Dairy and alternatives |
8% |
|
Oils and spreads |
1% |
|
Foods to eat less often and in small amounts (although not shown visually as a segment in the final image) |
3% |
This table shows that the guide recommends eating approximately the same weight of fruit and vegetables as starchy carbohydrates like bread, rice, and potatoes so when the table is converted from average food weight to calories it becomes clear that the Eatwell Guide proposes a much lower calorie intake from from fruit and vegetables than from starchy carbohydrates, simply because fruit and vegetables have a much lower energy density than starchy carbohydrates (i.e. 100g of vegetables provides significantly fewer calories than 100g of white bread).
As a further complication, most food types are actually a mixture of macronutrients (i.e. carbohydrates, fat, protein, and fibre) and you can obtain a lot of protein from a high vegetable consumption. Is this accounted for in "other proteins" in the chart? It baffles me how anybody is expected to be able to interpret this guide in a meaningful way when it is so ambiguous. A quick look on the Diabetes UK forums will reveal that many doctors are strongly opposed to the Eatwell Guide as they consider its advice about intake from starchy carbohydrates to be inappropriate at a time when we are facing an epidemic of obesity and type 2 diabetes.
I also found this very strongly expressed view on the Eatwell Guide from Dr Zoe Harcombe : http://www.zoeharcombe.com/2016/03/eatwell-guide. Dr Harcombe confirmed with the Food Standard Agency that the Eatwell Guide is indeed based on relative weights of the different food types and she then converted those relative weights of food into estimated kcals (carbohydrates, fibre, and proteins are converted at 4kcals/g while fat is converted at 9kcals/g). When those conversions have been computed, the relative food proportions in kcals become clear :
|
With junk included |
Without junk |
|||
|
NEW ‘Eatwell’ guide |
% in diagram |
% cal intake |
% in diagram |
% cal intake |
|
Starchy foods |
37% |
62% |
38% |
68% |
|
Fruit & veg |
39% |
8% |
40% |
9% |
|
Dairy & alternatives |
8% |
6% |
8% |
7% |
|
Beans, pulses, fish, eggs, meat etc |
12% |
11% |
12% |
12% |
|
Oils & spreads |
1% |
4% |
1% |
4% |
|
Junk |
3% |
9% |
|
|
The Eatwell Guide recommends consuming about two thirds of our daily calories from starch foods so it is definitely not a Mediterranean style of diet. Unfortunately it also reflects the pattern of my food intake for about the past four decades as I attempted to keep to the guidelines of the "low fat" diet that was promoted from the late 1970s. However, in my case, it was clearly not a very successful diet for me as my weight gradually increased from 68kg to 85.5kg over that period, in spite of exercising and avoiding junk food. Even worse, as I discovered by chance after I moved to the low carb Mediterranean diet, starchy carbohydrates are actually bad news for me as they seem to kill my energy levels. I discovered this after having eliminated starchy carbohydrates from my diet for a period of about two months during which time my energy levels soared. Yet a temporary return to eating carbs for just afew days over Christmas caused a major crash in energy levels and level me feeling extremely tired and lethargicwith a much increased need for sleep. All it took was four days, yet the effect was significant and left me feeling quite unwell in comparison to the previous couple of months. Fortunately my previous high energy levels returned within a few days of reverting to my low carb Mediterranean diet which led me to conclude that starchy carbs are off limits to me on any regular basis. Yet that was the way I ate for years previously. Quite amazing that such a small change of food intake could have such a profound effect on my feelings of wellbeing.
I am neither a doctor nor a nutritionist so I am unqualified to say whether Dr Harcombe's castigation of the Eatwell Guide on her website as the "Eatbadly Guide" is really justified but I find her arguments compelling as they resonate with my views on this poorly presented piece of advice that is anything but clear. As someone who was genuinely trying to use the Eatwell Guide to help change my dietary balance I found it utterly confusing and inconsistent, and for me its message on eating a large proportion of starchy carbohydrate in my diet is positively bad. If you believe that the Mediterranean Diet promoted by Dr Michael Mosley and Professor Roy Taylor is the route to lowering your blood sugar then the Eatwell Guide seems to be out of line with the latest thinking on blood sugar control. Check out the discussions on the Diabetes UK forums if you want to follow this debate further.
As the Mediterranean Diet has reversed my pre-diabetes amd elevated cholesterol level I will continue to ignore the Eatwell Guide's recommendations on eating starchy carbohydrates. I do still eat carbohydrates because they provide a lot of essential nutrients, but I eat 50% less calories from carbs than previously, and the carbs are all of the "slow" variety - either wholegrains or green carbs from more vegetables and fruit.
The descriptions of "Low Carb ", "Ultra Low Carb", etc are not standardized but I would say my average carbohydrate intake of 158g per day is moderate to low. Maybe at some future point I will experiment with a period of low carb intake (generally taken as much less than 130g per day) to see if that produces further improvements in my blood sugar levels but possibly not, since any dietary extreme is always going to be difficult to maintain long term.